
This week James Montier of GMO released an interesting white paper that is a scathing critique of the idea of “shareholder value maximization”
(SVM), the doctrine that corporate executives should focus above all else on maximizing returns for shareholders, and that they should be compensated with stock and/or options in order to give them proper incentives to do. He makes many points, but perhaps his central piece of evidence, what he
terms the “prima facie case against SVM,” is that during the era of SVM returns to stockholders have been lower than in the previous period. He
produces the following figure:
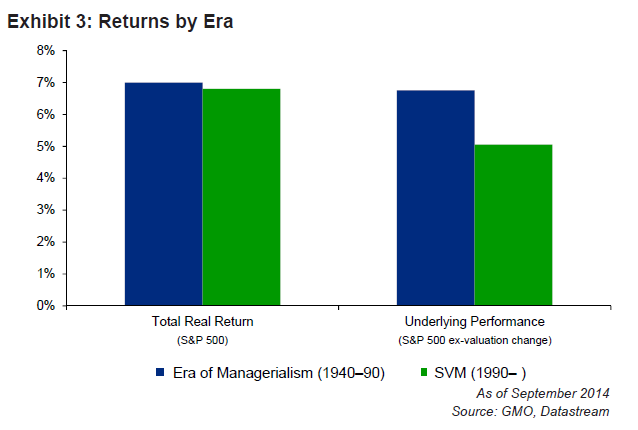
The bars on the left show the annualized real (CPI adjusted)
compound returns. Realized returns were very similar over
the two eras. Montier then observes (correctly) that a significant portion
of the returns in the second period are simply due to P/E multiple expansion,
which “have nothing to do with the underlying return generation of companies,
but rather reflect the price that the market is willing to put upon those
returns.” That is, corporate executives shouldn't get credit just because stocks
became more expensive overall---they should only get credit for dividends and
earnings growth.
Montier attempts to adjust for valuation to recover “underlying
performance”, producing the bars on the right of the figure. He doesn't say exactly how he does this, but the
most obvious way is to simply reduce the realized returns by a factor
representing the growth in the Shiller CAPE between the beginning and the end
of the period.[1] I
used this method (and Robert Shiller’s data) to recreate Montier’s results, as
shown in the first two rows of table 1. My results appear very close to the numbers from
Montier’s figure. After the adjustment, performance in the SVM era looks much
worse than in the previous era.
But this is where I believe Montier made a mistake: valuations don’t just matter at the
beginning and end of the period, they matter in the middle too, because they determine the price at which dividends are reinvested. A big factor raising
compound returns in the earlier era was that dividends could be reinvested at
the much lower average valuations that existed over this era. A big factor
lowering returns in the later era was that dividends were reinvested at much higher
average valuations, (including those around the internet bubble).
If executives don’t deserve credit for a change in valuation
between the beginning and end of the period, then they also don’t deserve
credit (or blame) for the path of valuations during the period.
A better way to remove the valuation element would be to see
what returns would have been if valuation had been constant over the entire period.
I calculated the returns for the two eras, using earnings and dividends in each
quarter as given, but assuming index prices
changed such that the CAPE maintained a constant value of 18, (the average over
the entire period). The result is shown in the third row of the table.
Table 1
Era of Managerialism
1940 Q1 – 1989 Q4 |
Era of SVM
1990 Q1 – 2014 Q3 |
|
Realized Return (annualized compounded, dividends reinvested)
|
6.94%
|
6.81%
|
Return corrected for starting and ending valuation
|
6.77%
|
5.14%
|
Return corrected for valuation over entire period (CAPE=18)
|
5.55%
|
5.83%
|
Using this method reverses the conclusion: now, “underlying
performance” in the era of shareholder value maximization actually looks
somewhat better than in the Era of Managerialism.
One may wonder why multiples were so low in the last
couple of decades of the earlier era? It may have something to do with
the fact that, adjusted for inflation, index earnings showed virtually no
growth over the latter half of this era, despite substantial retained earnings. While "underlying performance" was good in the 1940s and 1950s, it was particularly poor over the last couple of decades of the Era of Managerialism.
The following figure shows 5-year moving averages of index
earnings, and earnings retained (after dividends, not accounting for repurchases), measured in 2010 dollars.

Whatever corporations were doing with their substantial
retained earnings in these middle decades, it didn't translate into any per-share real earnings
growth, and this didn't change until right around the time the SVM era started.
There may be many possible reasons for this, but one factor might be that, before SVM, managers had little incentive not to waste money in empire building or other
unprofitable projects, rather than simply returning cash to shareholders.
Another possibility might be that in the era before stock buybacks (another
thing widely disliked by critics of shareholder value), managers who were reluctant to
raise dividends too quickly found it difficult to return cash to shareholders even
when they had few attractive investment opportunities.
This is far from an open and shut case, and there are many other criticisms and issues that could be examined. But based on the "underlying performance" of dividends and earnings, it appears that the shareholder value movement, far from being the “world’s
dumbest idea,” has actually been fairly successful.
[1] In this counterfactual case, on the last day of 2014 Q3, the S&P500
suddenly falls from its value of 1972 down to 1335, thus returning
the CAPE from 26.2 all the way down to the level of 17.6 that it had at the end
of 1989. This knocks about 1.7% off the SVM era returns, as shown in the
second row of table 1. A similar
adjustment is done for the earlier era, but it makes much less difference since
the CAPE was close to the same at the beginning and end of the period.